Where Data Tells the Story
© Voronoi 2026. All rights reserved.

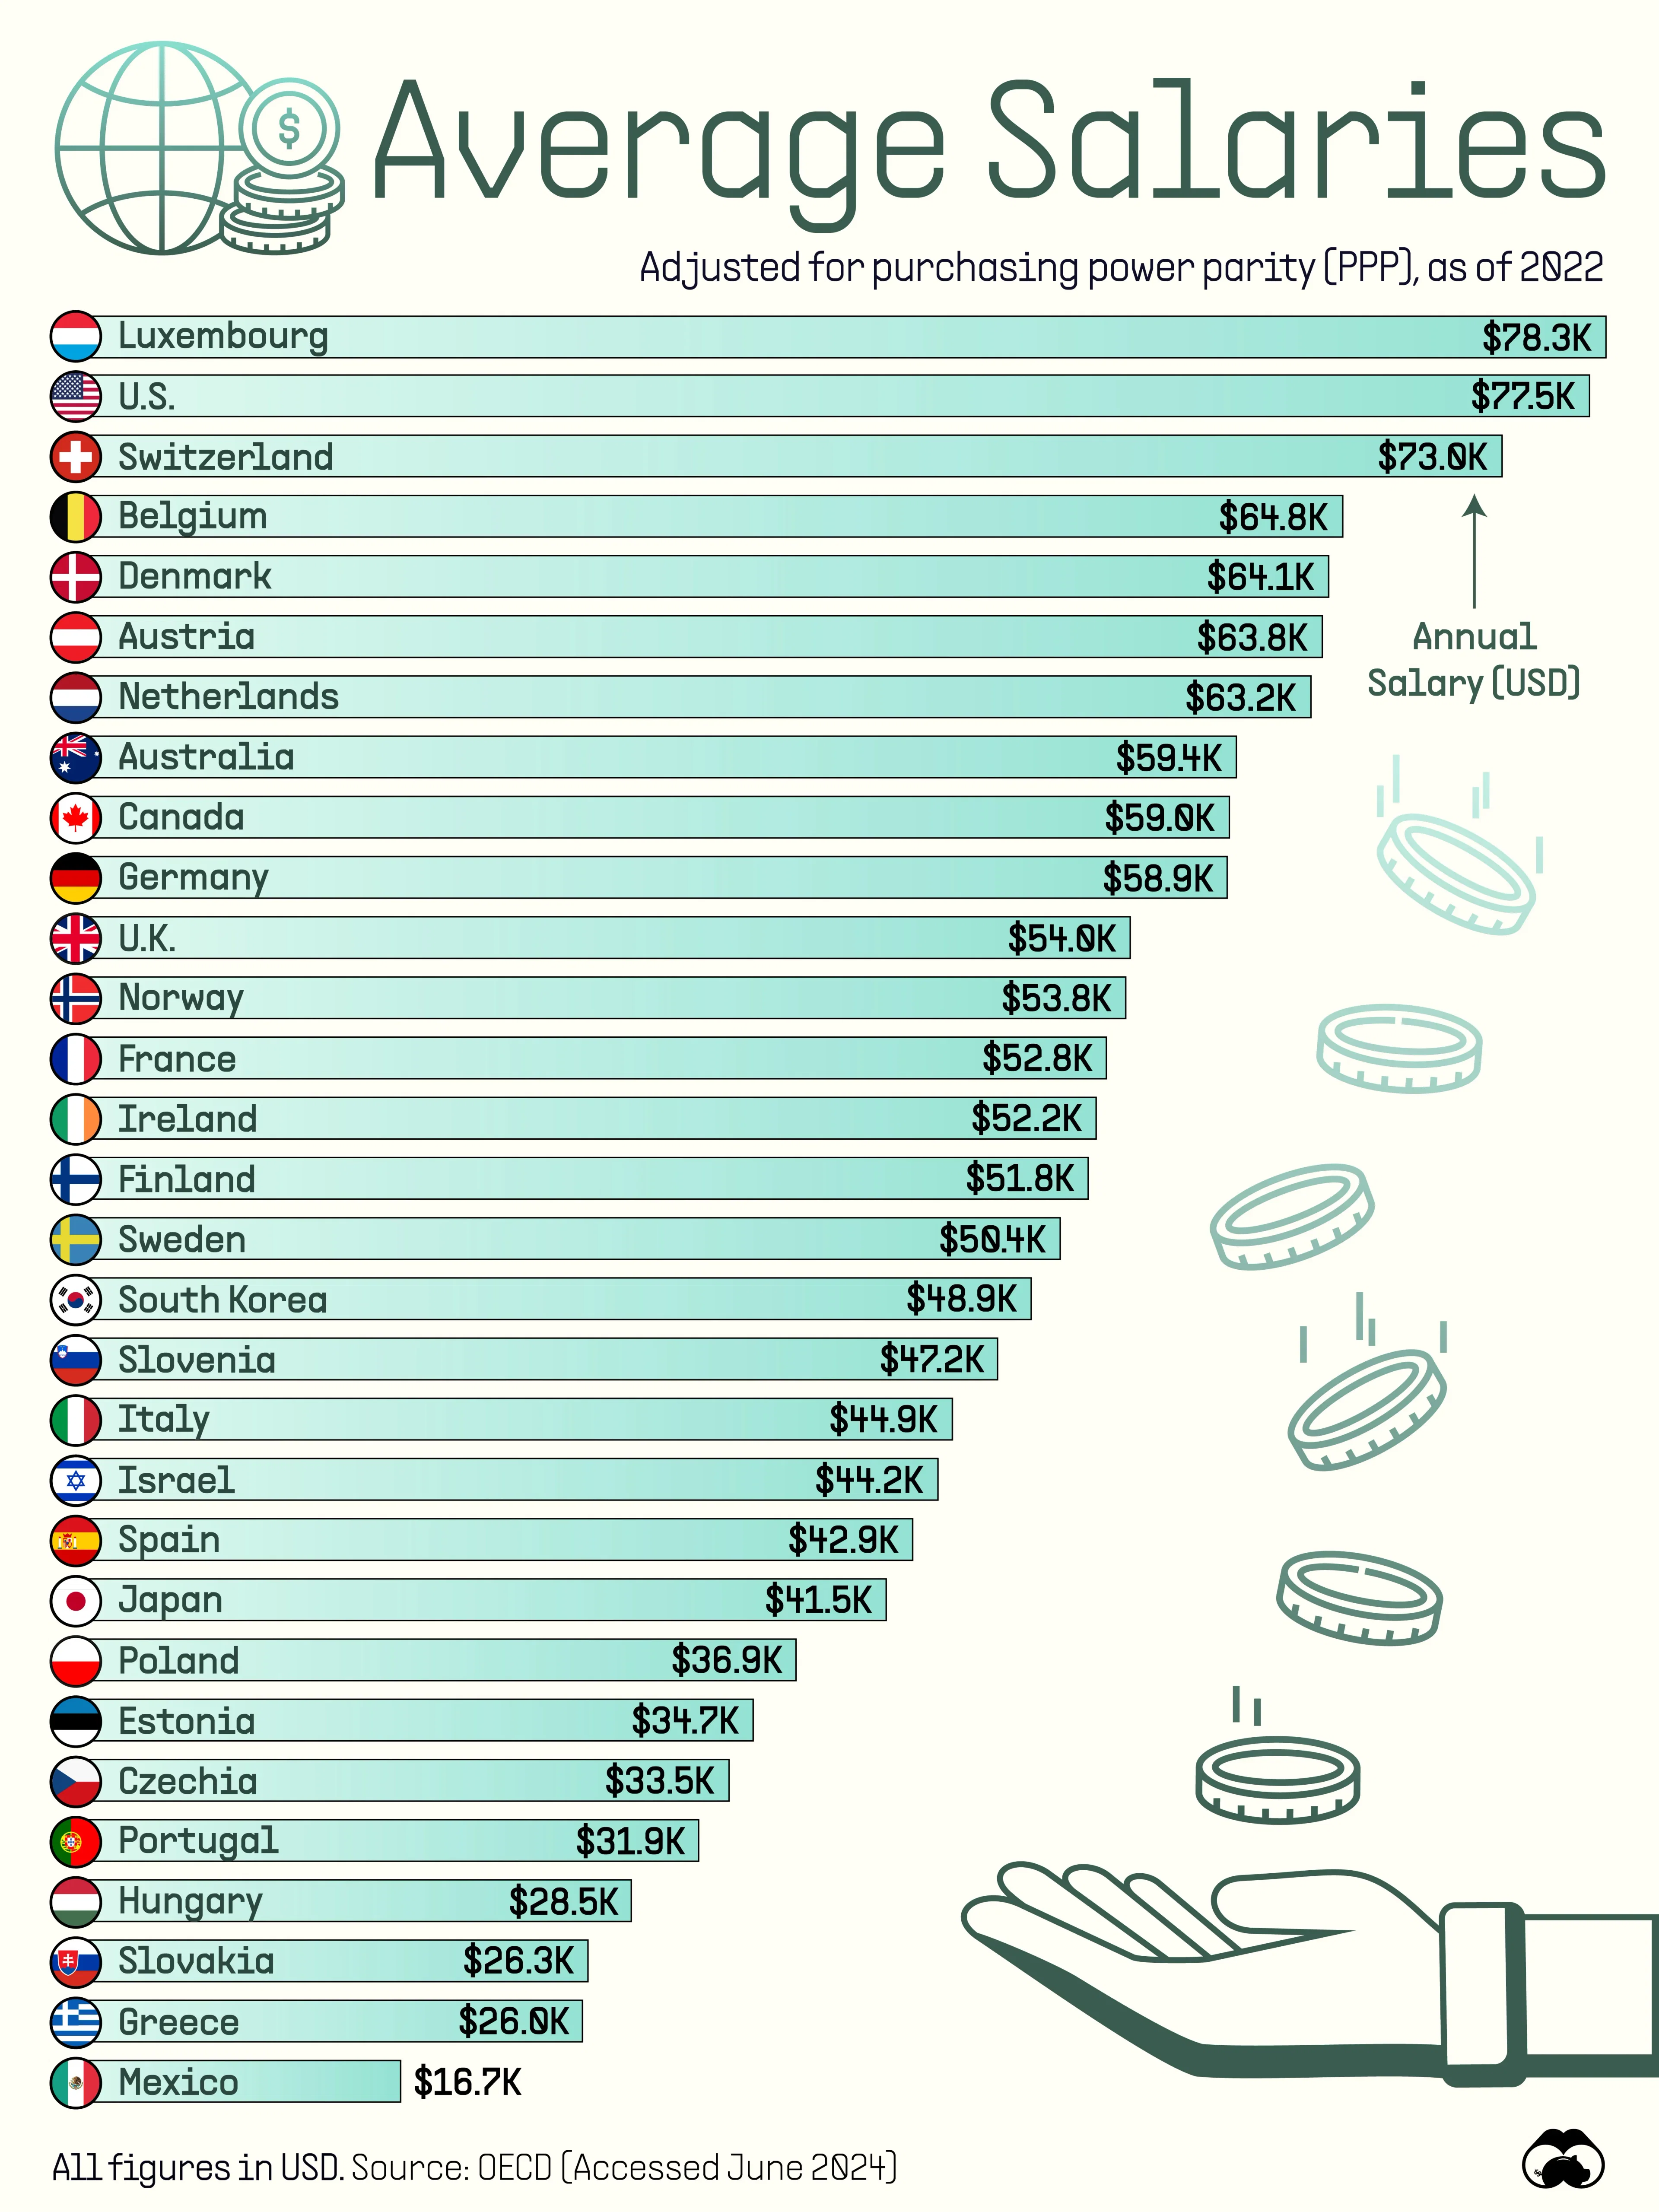
This graphic visualizes the average annual salaries of OECD countries, as of 2022. All figures have been adjusted for purchasing power parity (PPP), and were sourced from the OECD database (accessed June 2024).
The OECD (Organisation for Economic Co-operation and Development) is an international organization that promotes policies to improve economic and social well-being. It has 38 member countries, though data for all of them was not available.
Broadly speaking, average salaries are going to be higher in countries with a higher cost of living. For example, Switzerland is one of the most expensive countries to live in, with monthly living costs of $2,497 USD according to World Population Review.