Where Data Tells the Story
© Voronoi 2025. All rights reserved.

Over the past decades, semiconductors have become ubiquitous not only in devices like smartphones, computers or appliances but also in manufacturing, for example in the automotive or industrial robot sectors. But which industries have the biggest share in purchased semiconductors?
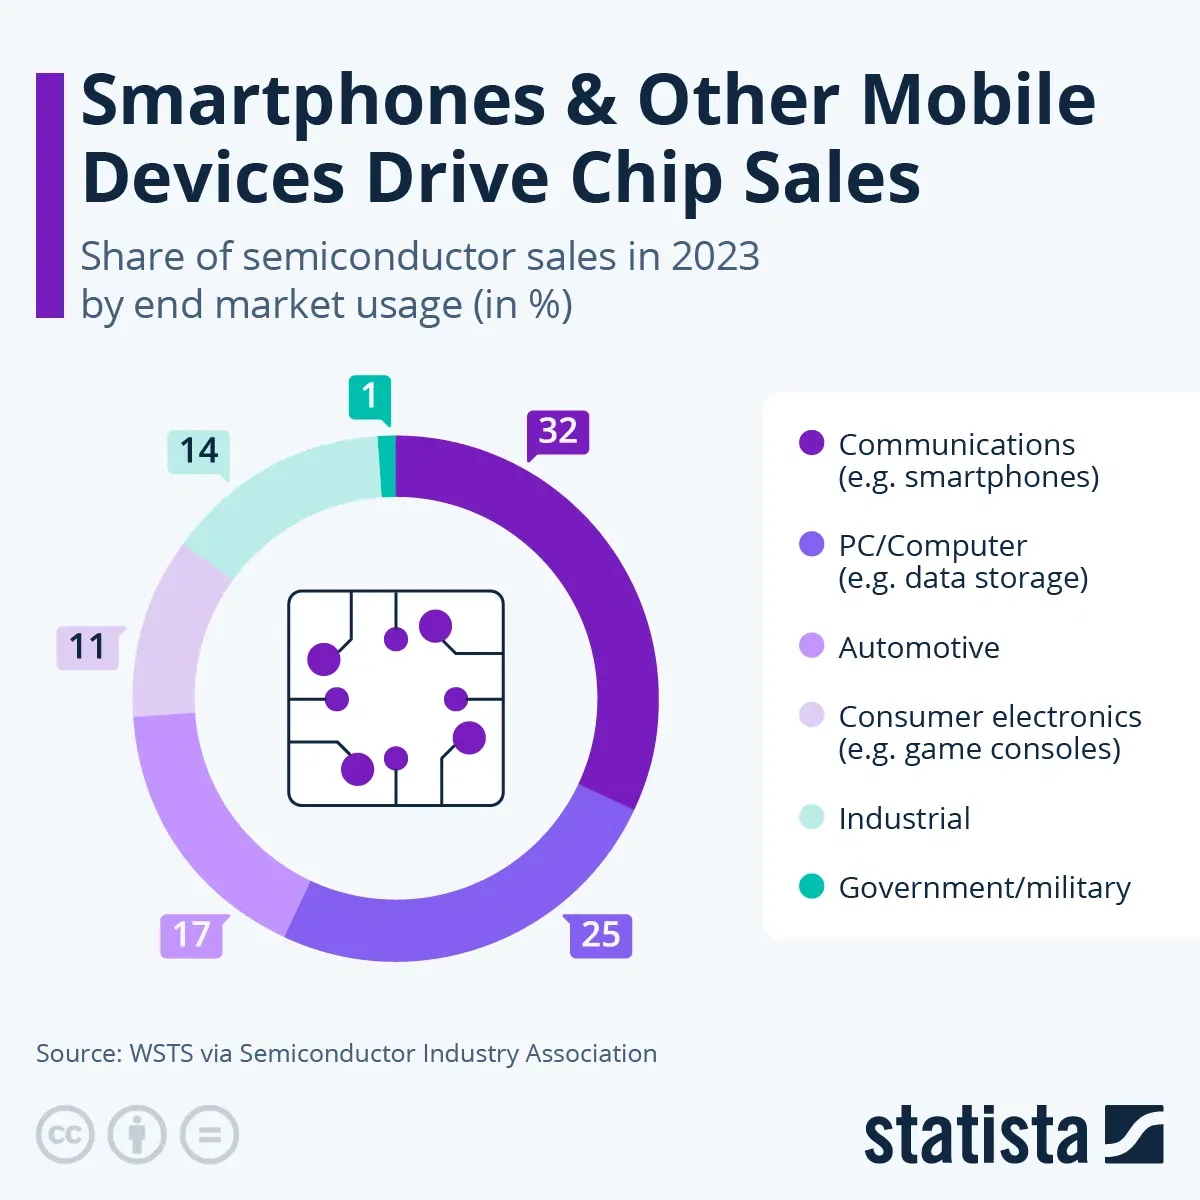
Data from the U.S. lobby group Semiconductor Industry Association’s (SIA) 2024 factbook shows that the majority of chips purchased in 2023 are used in the PC and communications segments. The former includes everything from computer memory to chips used in data centers, while the latter encompasses smartphones, tablets and other wireless and wired communications devices. 57 percent of the estimated $527 billion in semiconductor sales were attributed to these two industries. Automotive and industrial exhibited shares of 17 and 14 percent, respectively, while consumer electronics made up 11 percent of the total semiconductor market in the past year.
Looking at the development of the chips market, the SIA recorded a significant downturn compared to 2022. According to a press release from March 2023, the industry organization estimated a market volume of $574 billion in 2022, which translates to a drop in sales revenue by eight percent year over year. However, the respective industry shares remained largely consistent in 2022 and 2021.
SIA also posits that the U.S. semiconductor industry held a revenue market share of 50.2 percent, although this figure needs to be scrutinized closely. For example, Nvidia is a semiconductor company headquartered in the United States, but its chips are manufactured by the world-leading semiconductor foundry TSMC in Taiwan. So while U.S. companies might make the most money with chip sales, the brunt of the actual production is carried out elsewhere. 70 percent of 300mm wafers, considered the current industry standard in terms of efficiency, are manufactured in South Korea, Taiwan and China.