Where Data Tells the Story
© Voronoi 2026. All rights reserved.
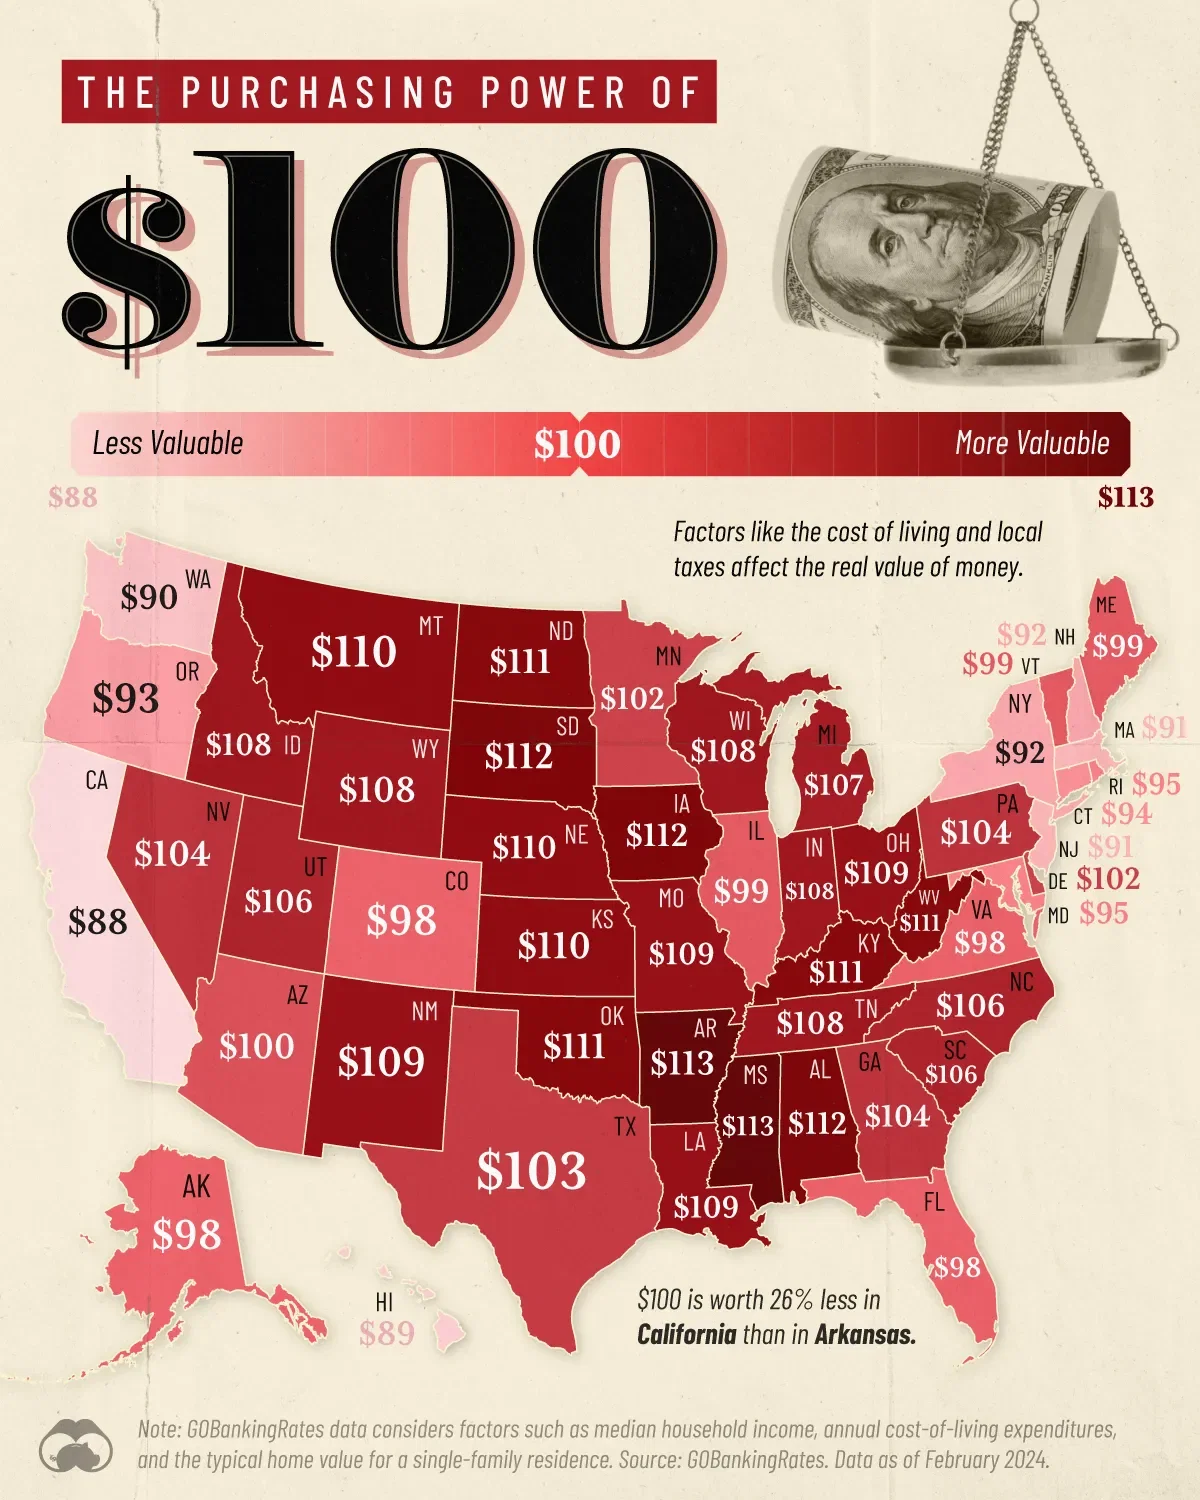
This map compares the purchasing power of $100 by state. GOBankingRates compiled the data as of February 19, 2024.
GOBankingRates compiled data from the release of U.S. Bureau of Economic Affairs 2022 Regional Price Parities. It used factors such as median household income, sourced from the 2022 American Community Survey, annual cost-of-living expenditures, sourced from the Bureau of Labor Statistics: 2022 Consumer Expenditure, and typical home value for a single-family residence, sourced from Zillow. All data was collected on and up to date as of Feb. 19, 2024.