Jun 24, 2024
Broad Money Supply in Advanced Economies
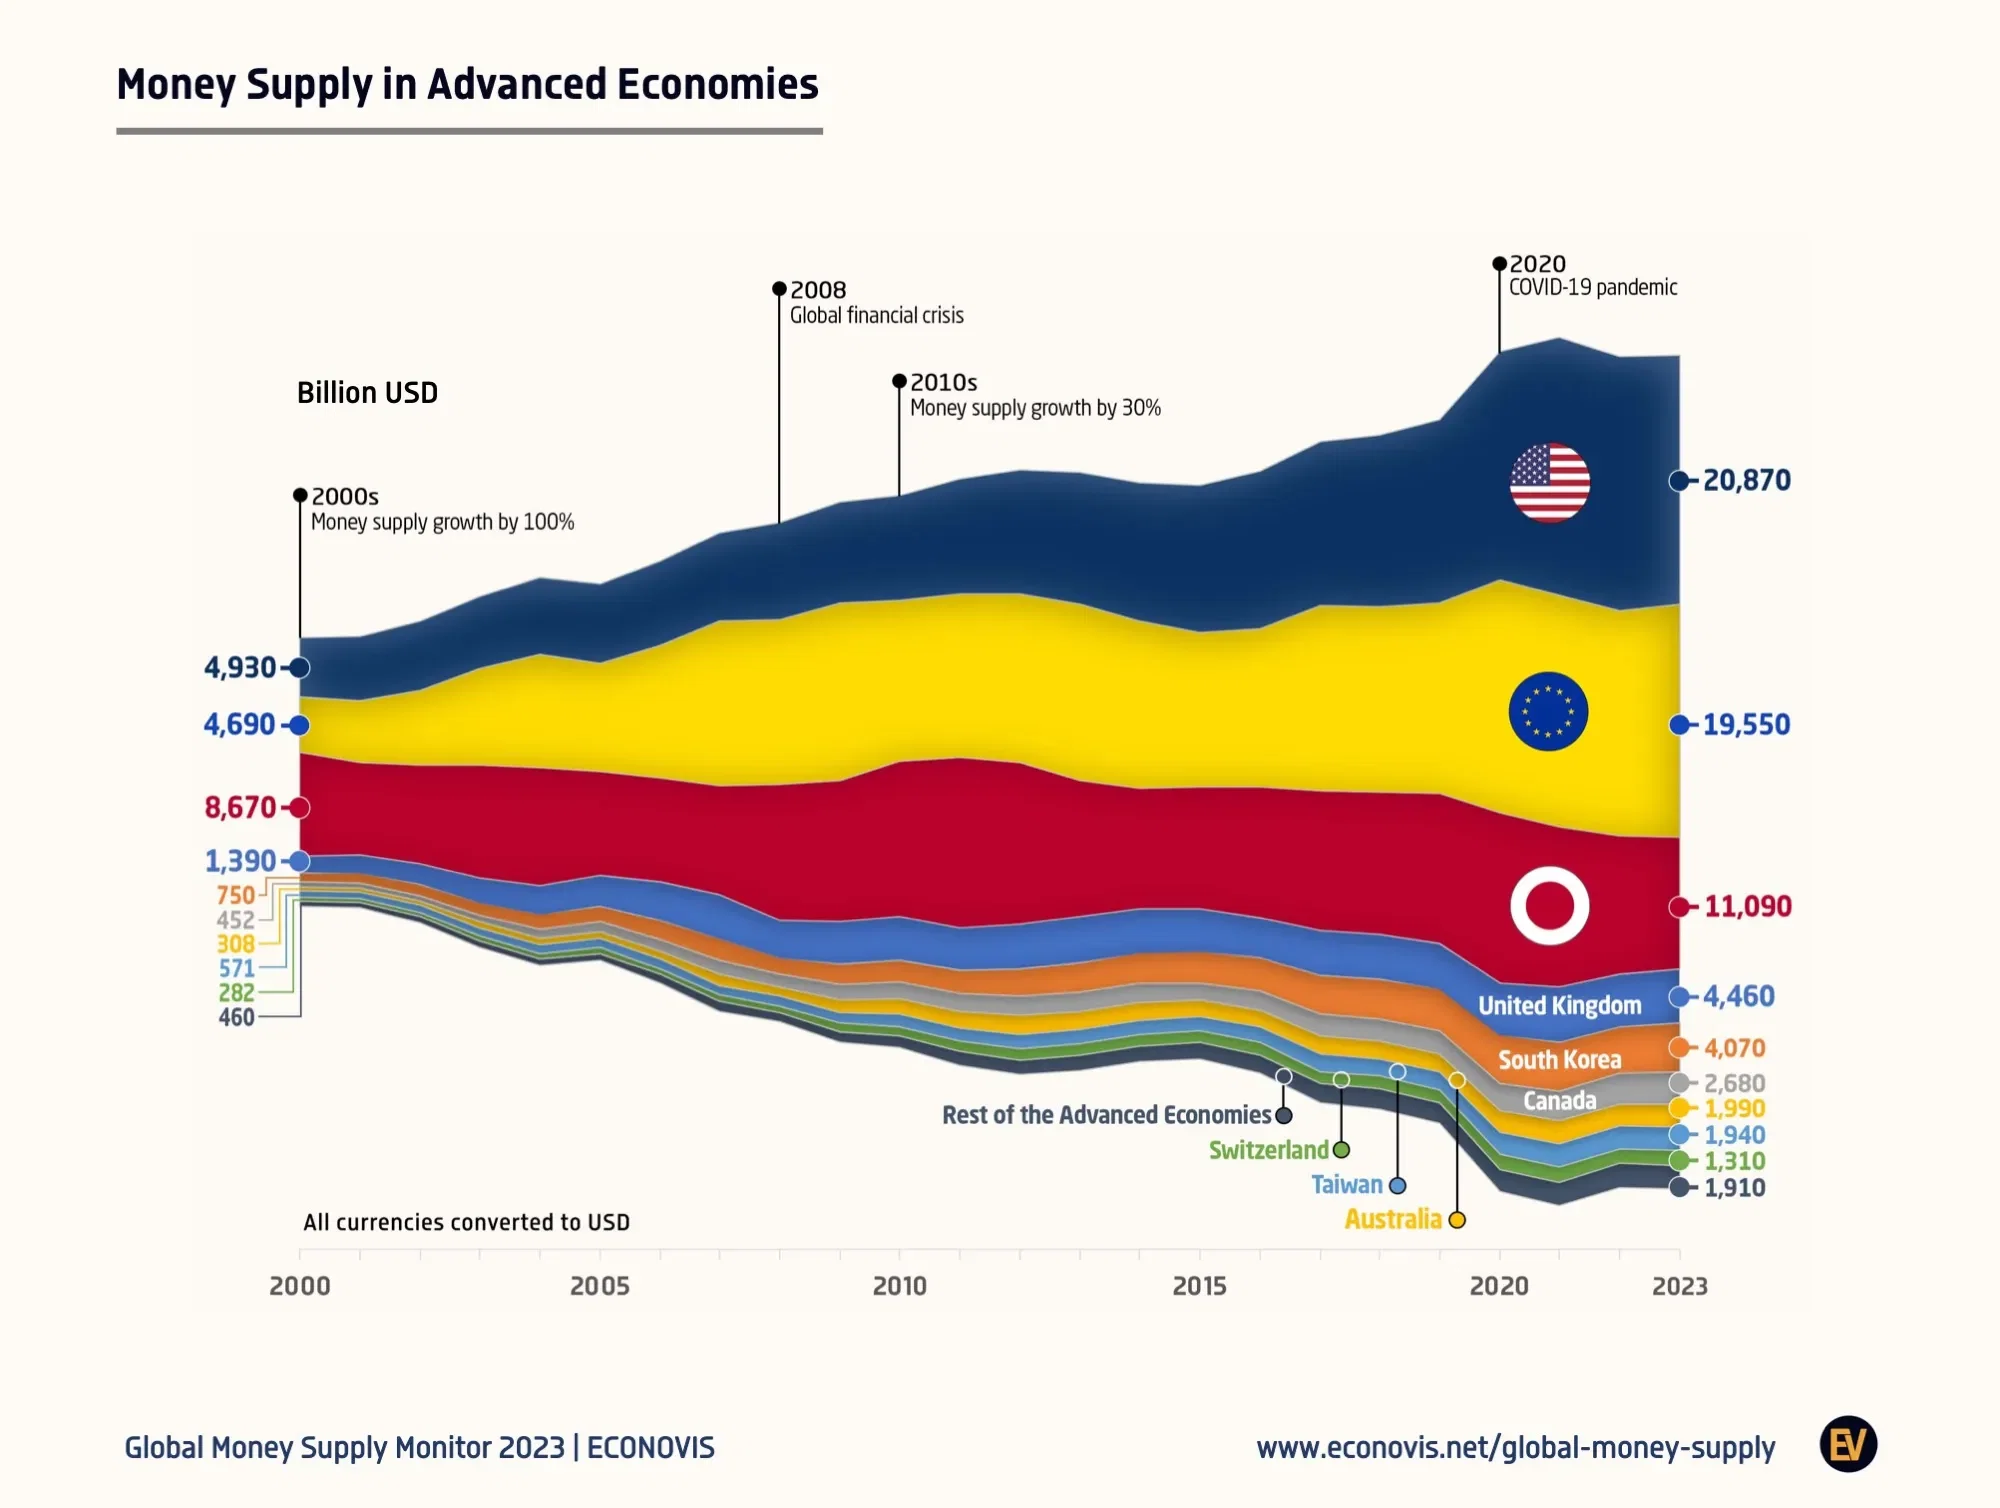
The broad money supply in advanced economies has shown significant growth over the past two decades. In 2000, the total broad money supply stood at $22 trillion. By 2023, this figure had increased substantially to $70 trillion. This growth represents a compound annual growth rate (CAGR) of 5.0%, highlighting the expansion of monetary assets in these economies over the 23-year period.
Dataset
Broad Money Supply in Advanced Economies | ||||||||||
---|---|---|---|---|---|---|---|---|---|---|
Trillion US$ | ||||||||||
U.S. | EU | Japan | UK | Korea | Canada | Australia | Taiwan | Switzerland | Rest of the Advanced Economies | |
2000 | 4.93 | 4.69 | 8.67 | 1.39 | 0.75 | 0.45 | 0.31 | 0.57 | 0.28 | 0.46 |
2001 | 5.43 | 5.16 | 7.78 | 1.49 | 0.79 | 0.45 | 0.31 | 0.57 | 0.30 | 0.45 |
2002 | 5.77 | 6.29 | 8.26 | 1.71 | 0.96 | 0.49 | 0.35 | 0.58 | 0.37 | 0.49 |
2003 | 6.07 | 8.09 | 9.46 | 2.04 | 1.01 | 0.62 | 0.50 | 0.63 | 0.45 | 0.54 |
2004 | 6.42 | 9.41 | 9.91 | 2.46 | 1.23 | 0.73 | 0.56 | 0.71 | 0.51 | 0.55 |
2005 | 6.68 | 9.06 | 8.71 | 2.50 | 1.36 | 0.83 | 0.59 | 0.73 | 0.47 | 0.57 |
2006 | 7.07 | 11.09 | 8.75 | 3.18 | 1.66 | 0.91 | 0.70 | 0.79 | 0.52 | 0.67 |
2007 | 7.47 | 13.68 | 9.19 | 3.68 | 1.82 | 1.18 | 0.93 | 0.80 | 0.56 | 0.79 |
2008 | 8.19 | 13.77 | 11.40 | 3.19 | 1.35 | 1.05 | 0.81 | 0.84 | 0.58 | 0.74 |
2009 | 8.50 | 14.83 | 11.82 | 3.58 | 1.73 | 1.24 | 1.12 | 0.91 | 0.68 | 0.87 |
2010 | 8.80 | 13.46 | 12.99 | 3.63 | 1.86 | 1.39 | 1.33 | 1.04 | 0.78 | 0.99 |
2011 | 9.66 | 13.66 | 14.29 | 3.54 | 1.98 | 1.48 | 1.46 | 1.07 | 0.87 | 1.09 |
2012 | 10.46 | 14.08 | 13.56 | 3.77 | 2.28 | 1.61 | 1.61 | 1.16 | 0.97 | 1.24 |
2013 | 11.04 | 14.76 | 11.35 | 3.89 | 2.48 | 1.63 | 1.46 | 1.19 | 1.03 | 1.28 |
2014 | 11.69 | 13.94 | 10.13 | 3.70 | 2.58 | 1.61 | 1.44 | 1.20 | 0.97 | 1.33 |
2015 | 12.35 | 12.97 | 10.18 | 3.60 | 2.65 | 1.47 | 1.34 | 1.22 | 0.97 | 1.37 |
2016 | 13.21 | 13.17 | 11.04 | 3.29 | 2.81 | 1.63 | 1.45 | 1.29 | 0.98 | 1.50 |
2017 | 13.85 | 15.46 | 11.68 | 3.76 | 3.28 | 1.79 | 1.58 | 1.43 | 1.04 | 1.60 |
2018 | 14.36 | 15.50 | 12.01 | 3.68 | 3.40 | 1.81 | 1.51 | 1.43 | 1.07 | 1.63 |
2019 | 15.31 | 15.91 | 12.61 | 3.79 | 3.51 | 1.99 | 1.48 | 1.52 | 1.09 | 1.70 |
2020 | 19.10 | 19.46 | 14.27 | 4.37 | 4.08 | 2.28 | 1.83 | 1.78 | 1.29 | 1.89 |
2021 | 21.50 | 19.37 | 13.45 | 4.64 | 4.15 | 2.47 | 1.90 | 1.94 | 1.26 | 2.01 |
2022 | 21.31 | 18.81 | 11.63 | 4.37 | 3.94 | 2.51 | 1.91 | 1.88 | 1.24 | 2.01 |
2023 | 20.75 | 19.59 | 11.09 | 4.47 | 4.07 | 2.67 | 1.99 | 1.94 | 1.31 | 1.89 |
Data sources
https://www.federalreserve.gov/releases/h6/current/default.htmhttps://data.ecb.europa.eu/data/datasets/BSI/BSI.M.U2.Y.V.M30.X.1.U2.2300.Z01.Ehttps://www.bankofengland.co.uk/boeapps/database/fromshowcolumns.asp?Travel=NIxSTxTAxSUx&FromSeries=1&ToSeries=50&DAT=RNG&FD=1&FM=Jan&FY=1963&TD=31&TM=Dec&TY=2023&FNY=&CSVF=TT&html.x=180&html.y=50&C=5ZL&Filter=Nhttps://www.econovis.net/global-money-supply
6
0
6.3K