Oct 21, 2024
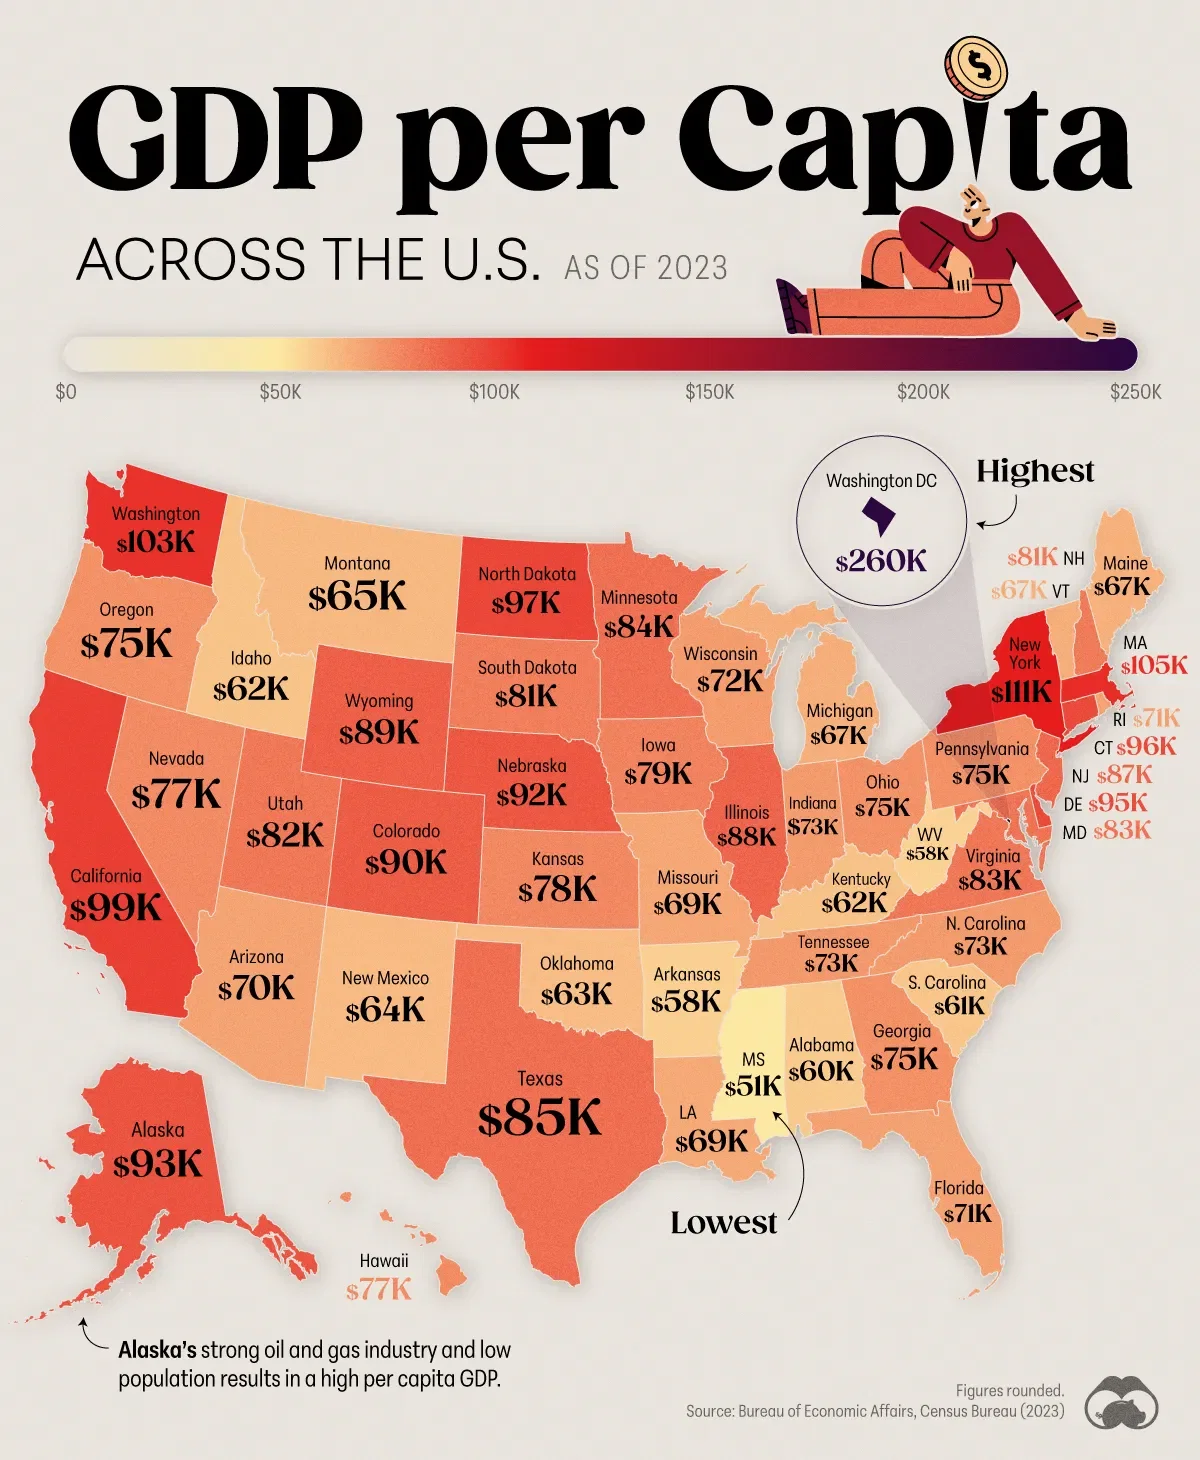
🇺🇸 America’s Average Economic Output, by Each State

What We’re Showing:
This map lists the GDP per capita for each U.S. state. Data was sourced from the Bureau of Economic Affairs and the Census Bureau, as of 2023.
Key Takeaways
Several general patterns emerge from this map. States with major metropolitan areas (New York, California) have a higher GDP per capita due to concentrated economic activity.
However, states rich in natural resources (e.g., Alaska, Wyoming, North Dakota) also have high GDP per capita also helped from smaller populations.
Meanwhile, Southern states (Mississippi, Arkansas) tend to have lower numbers, due to a proliferation of lower-wage industries like agriculture, meatpacking, and hospitality.